PHIM Responsive Header

Category: Latest News and Events

  • Point Prevalence Survey and Antibiogram Training Exercise

    Point Prevalence Survey and Antibiogram Training Exercise

    Point Prevalence Survey and Antibiogram Training Exercise

    The AMRNCC with funding from the Eastern, Southern and Central Africa (ESCA) recently conducted a training on the implementation of Point Prevalence Surveys (PPS) and the development of Antibiograms. This training involved 5 participants from 7 health facilities each namely; Mangochi District Hospital, Mzimba District Hospital, Malamulo Hospital, Mzuzu Central Hospital, Zomba Central Hospital, Kamuzu Central Hospital and Queen Elizabeth Central Hospital. The 5 participants included a member from the following cadres; infection prevention and control, nursing, laboratory, clinician and pharmacy. Point prevalence surveys and antibiograms are important and recommended to be done often by health facilities because they inform decisions at health facility level on antimicrobial use and antimicrobial effectiveness, respectively.

    This one-week trainer of trainer session was conducted at Chikho Hotel in Mponela from July 10th to 14th, 2023. Some of the topics covered during this session were; introduction to PPS, planning PPS, collecting data using the PPS tool, introduction to WHONET software, introduction to antibiograms, interpretation and use for guideline development and practical sessions for WHONET, PPS and Antibiograms.

    In order to solidify the knowledge gained during this classroom training, a pilot practical session, took place between July 24th to 28th July 2023.

    During this pilot session, the facility AMS teams performed and Point prevalence survey on antibiotic use using specific in-patient files and developed facility-specific antibiograms utilizing routine laboratory surveillance data. The pilot data collection session was supervised by key experts from the AMNRCC to ensure an efficient learning process and collection of data which may inform facility AMS activities. After the data collection exercise was done, the facilities are analyzing the data before disseminating their facility findings.

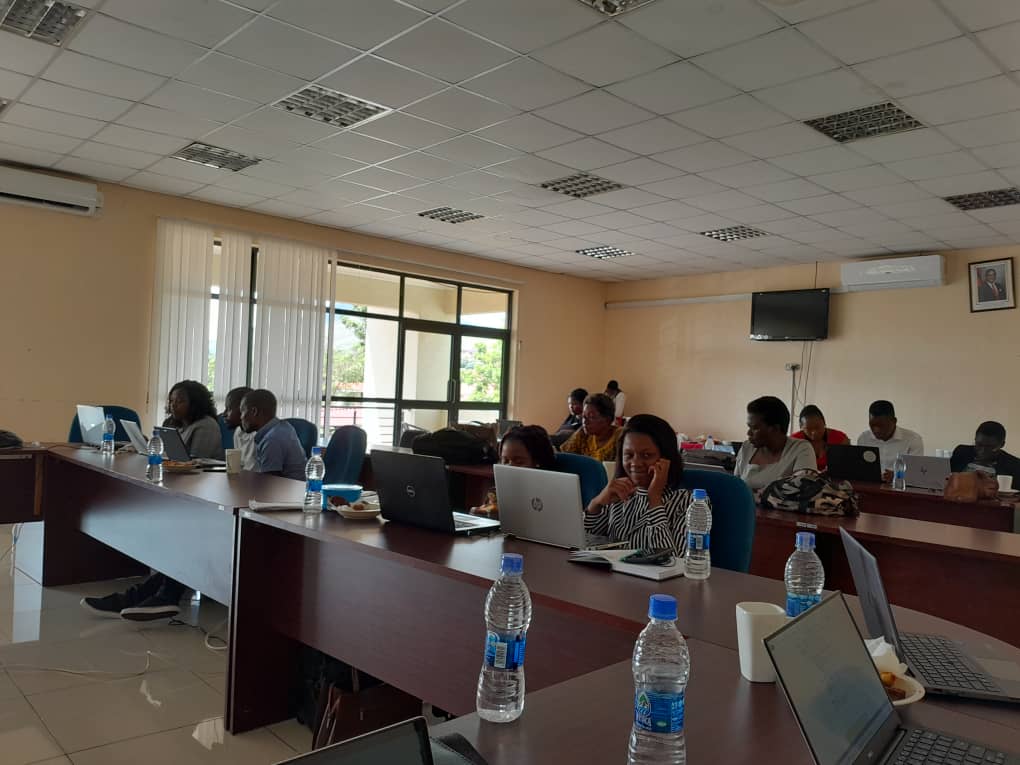
    Story in Pictures

    The activity being scaled down to facility level

  • Hazards


    PHIM – Multi-Hazard Risk Assessment Dashboard


    P
    Public Health Institute

    PHIM Multi-Hazard Risk Registry


    National Risk Assessment Frame

    Multi-Hazard Risk Registry Dashboard

    This analytical gateway maps structural, environmental, and biological hazards impacting our target zones. Synchronized directly with the institutional data reference file Hazards.docx.


    Assessment Model

    Total Evaluated

    29


    Hazards registered

    Very High Risk

    2

    Immediate mitigation

    High Risk

    11

    Critical focus points

    Moderate Risk

    12

    Routine surveillance

    Low Risk

    4

    Under monitoring

    National Hazards Matrix

    Real-time surveillance & analytical filter interface


    Severity Filters:


    S/N
    Specific Hazard
    Risk Level

    Hazard Registry Investigator

    Click on any hazard row in the table to display strategic mitigation measures, target protocols, and regulatory framework variables pulled from Hazards.docx.

    Framework Methodology

    How PHIM calculates and determines threat classifications


    Risk Matrix Calculations

    The Multi-hazard risk assessment tracks hazards using an integrated threat vector formula mapping global risk patterns to domestic geographical systems.

    Our systematic scoring correlates immediate geographical vulnerabilities against current structural containment levels.


    Surveillance Standards

    Each category in our ledger operates under strict protocols established in the master reference document Hazards.docx.

    These priorities dictate response times, resource mobilization scales, and inter-agency alert structures during crisis events.


    Urgent Threat Alert

    Very High and High risk factors call for immediate regional focus and active health system alerts. Any active change in environmental surveillance scores triggers auto-notification systems nationwide.

    Primary Reference:
    Institutional Record: Hazards.docx

    P


    Public Health Institute of Malawi © 2026. All Rights Reserved.

    Ref: Hazards.docx
    |
    Security Rating: Classified Institutional Data


  • Cholera cases continue to rise

    Cholera cases continue to rise.  Two hundred and sixty five (265) cumulative cases have been reported as of 15 January 2018 across the country with the highest number coming from Karonga at 196 cases.

    Other districts affected include Kasungu-1, Dowa-4, Nkhatabay-18, Lilongwe- 37, and Salima-9. However, new cases for the past five days have only been recorded in Karonga and Lilongwe.

    Since the start of the outbreak in November last year, four deaths, all from Karonga have been recorded with one community death and the other three facility deaths. It is important to note that all these deaths occurred in the initial stages of the outbreak.

    A total of 15 cholera patients are still admitted in the affected districts.

    Currently, intervention to curb the outbreak include intensive sensitization, intensive surveillance, contact follow ups, treatment of water and door to door campaigns aiming to reach out to every household.